How this issue is made.
A short, checkable account of what is sourced, what is illustrative, and what this publication deliberately does not claim. It is meant to be read by the person who doubts the numbers.
Editorial standard
InSignal Works is an editorial special project about technology, productive capacity and business investment. It is written to be useful to the person who has to decide, not to the person who has to be impressed.
Three rules govern everything here. A statistic must be dated or fixed to its data year, and attributed to the organisation that published it. A calculation must show its inputs and its assumptions. And a claim about outcomes must survive the question of who benefited and when.
This issue carries no advertising, no sponsored content and no vendor participation. If any of that changes, it will be disclosed on the page it affects, not in a footer.
What is sourced, and what is not
The distinction matters more than the citation format. The table below is the whole policy.
| Element | Treatment |
|---|---|
| National statistics | Reproduced from the publisher named in the source list, with its publication date or data year. Figures are fixed to that period and never presented as live. |
| The interactive exhibit | A browser model built for this issue. Every value on screen describes the model. No figure is a measurement of a real facility. |
| The payback worksheet | Arithmetic applied to inputs you enter. It is not a benchmark, a forecast or a valuation. |
| Photographs | Commissioned illustrations of generic Canadian production settings. No branding, no identifiable people, no implied endorsement. |
| Editorial prose | Written for this issue. No interviews, customer stories, testimonials, endorsements or earnings claims appear anywhere in it. |
The exhibit
The opening exhibit is a three-dimensional model of a small production line, rendered in the browser. It is an argument about arrangement: where time waits, where units queue, and how a line is actually put together. It is not a simulation of a specific plant, and it does not receive data from anywhere.
Every value it displays — transport speed, units moved, cycle timing — is a property of the model, set in code. The panel is labelled as illustrative for that reason. Nothing about the exhibit is a performance claim, a customer reference or a live reading.
On small screens, or when the reader has asked the system for reduced motion, the exhibit is replaced by a still photograph with tap targets and the same written inspection notes. The model is also skipped when the browser cannot provide WebGL, and rendering stops entirely once the exhibit scrolls out of view.
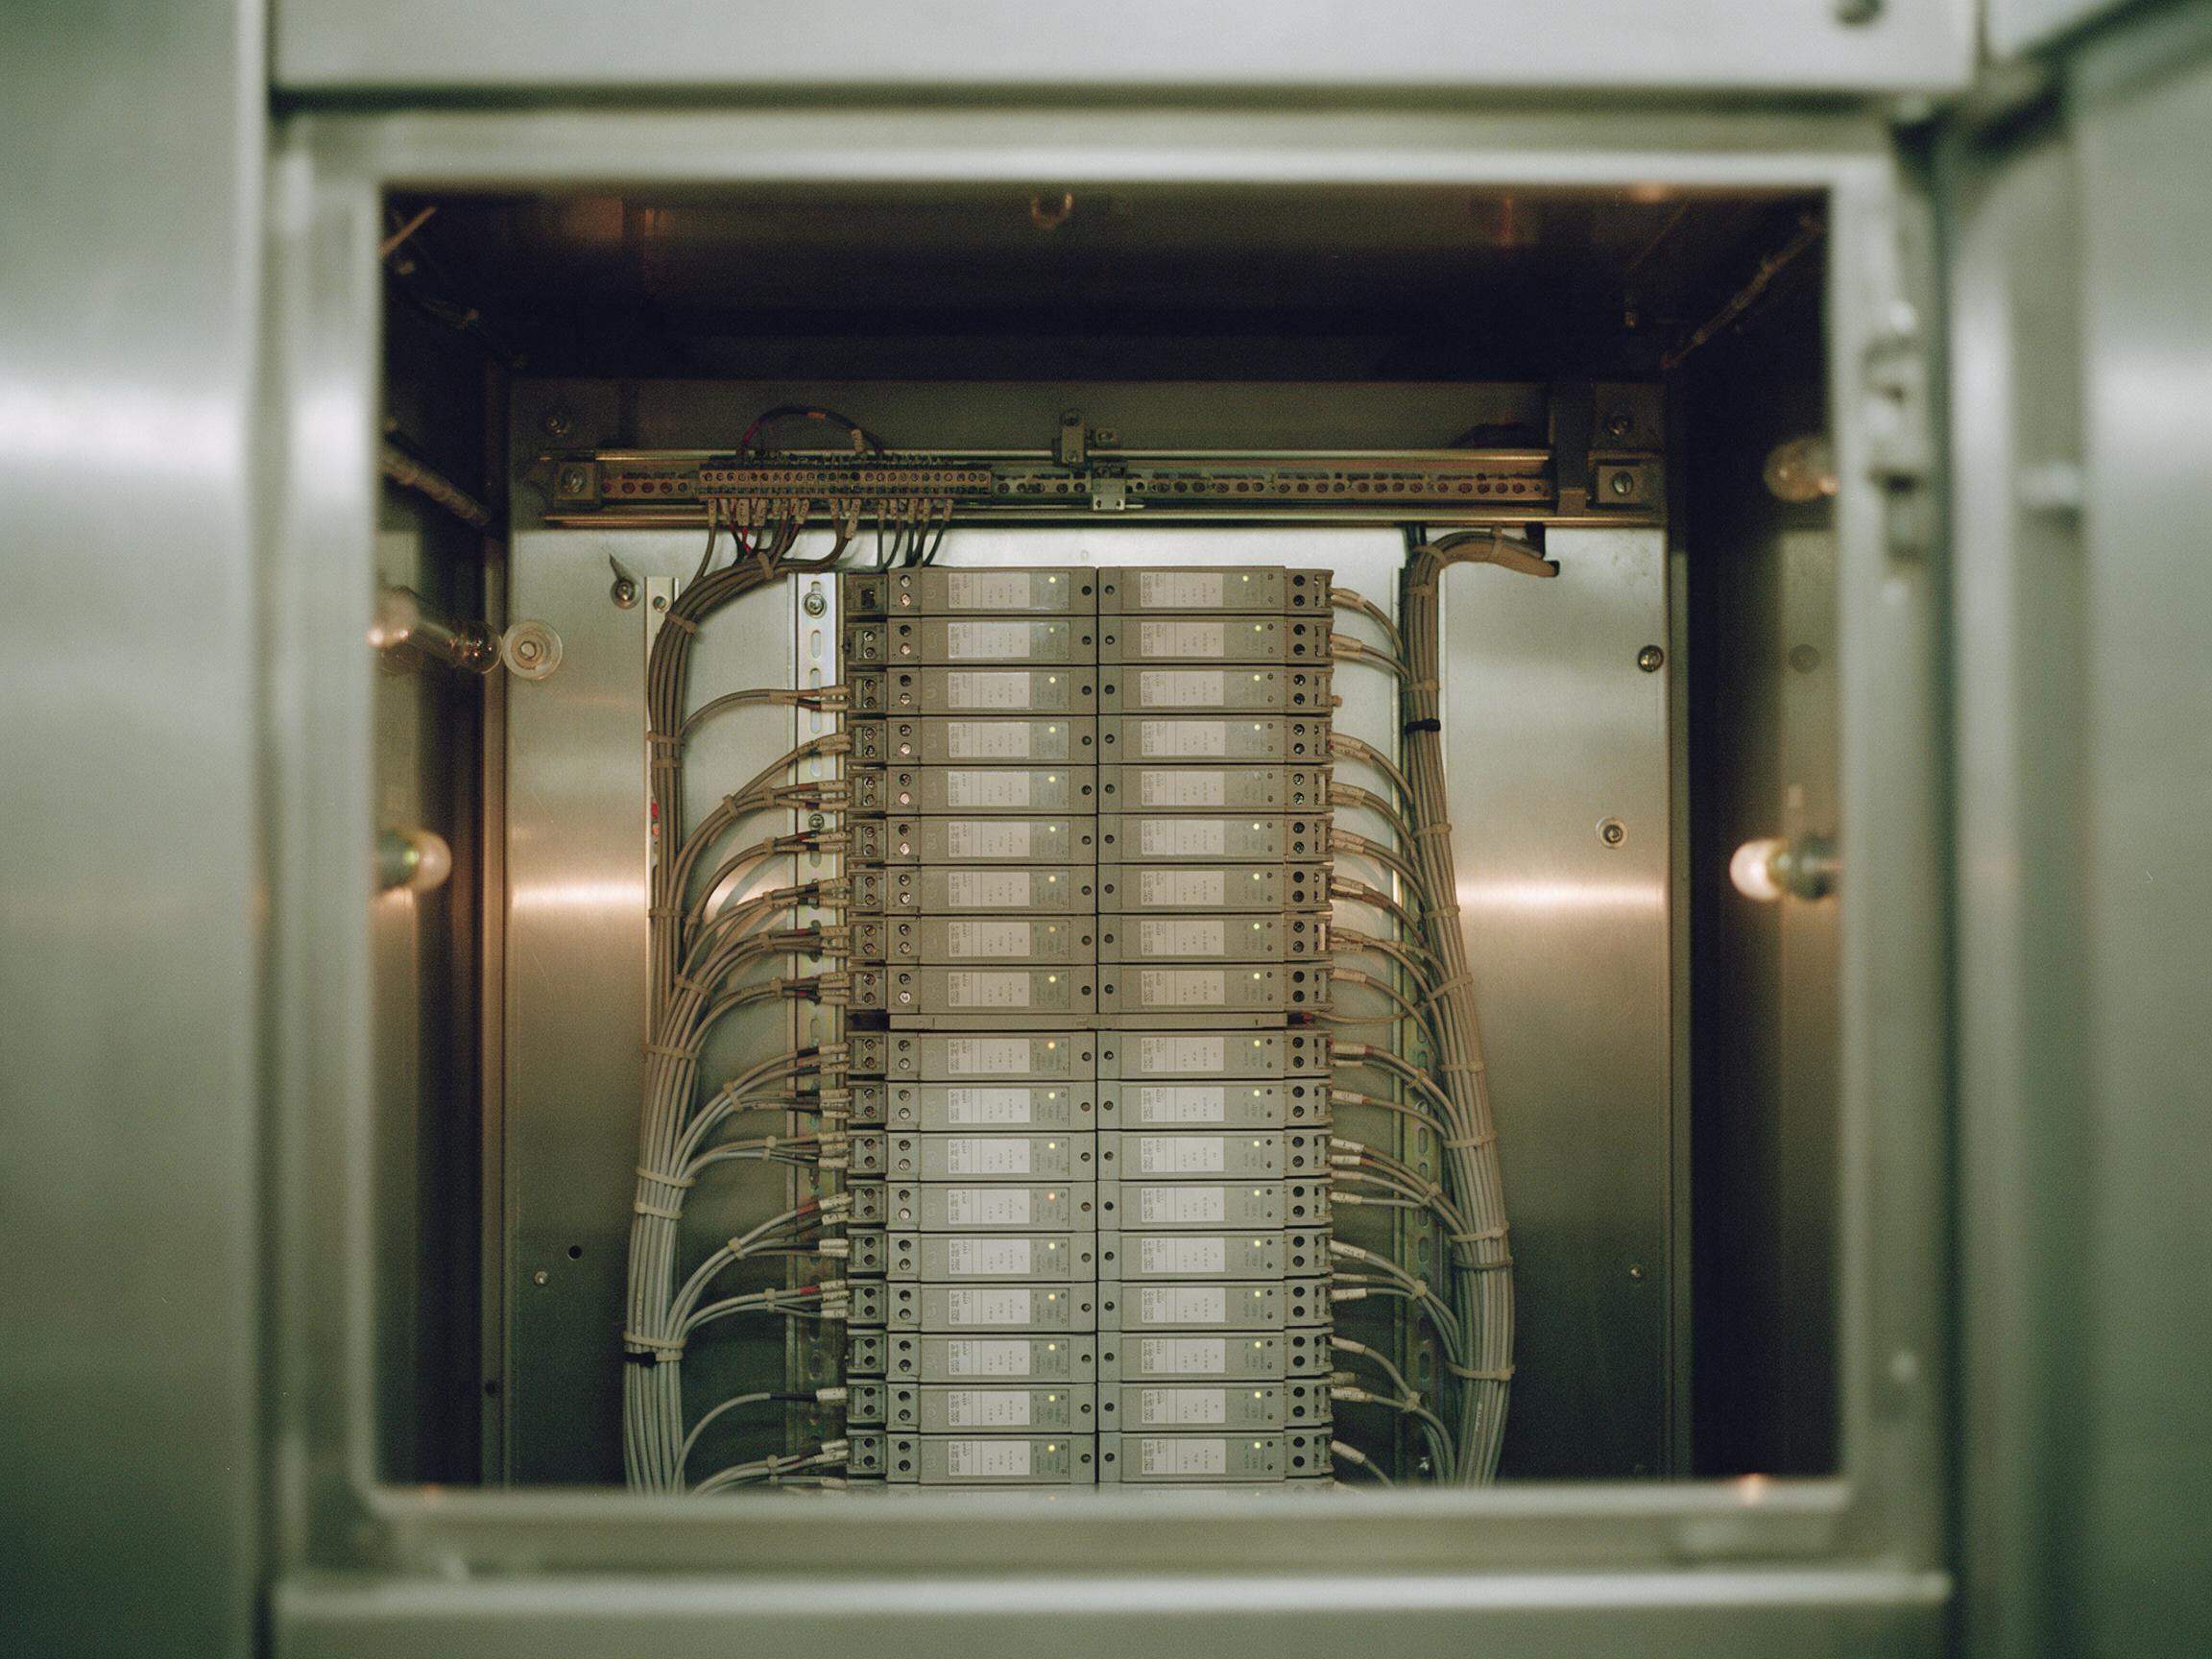
A populated cabinet, open. Every module inside belongs to a process that has to be programmed, documented and maintained — costs that rarely appear in a demonstration.
Illustration for InSignal Works, 2026
The worksheet
The worksheet applies one arithmetic chain to inputs the reader supplies. It is deliberately simple: linear, undiscounted and unadjusted for risk. The assumptions are printed beside the result rather than hidden in a tooltip.
When monthly net savings are zero or negative, the worksheet returns no payback and identifies which case applies. It will not divide by zero, and it will not substitute a default to produce a friendlier answer.
Images
Photography in this issue was commissioned as illustration. The frames show generic Canadian production settings with no branding, no identifiable individuals and no implied endorsement by any organisation. Captions identify them as illustrations rather than documentary records of a named facility.
Corrections
Corrections are published on the page where the error appeared, with the date of the change. Where a source revises a statistic, the revised figure replaces the original and the revision is noted here. No correction is made silently.
How to cite this issue
Cite the page, the publication and the date. For example: InSignal Works, “How to read a productivity number”, 13 November 2026.
Colophon and attribution
Set in Newsreader for reading text, Geist for interface and Martian Mono for labels and figures. The interactive model is adapted from an open project by Zsolt Kacso / Whitespace and carries the attribution required by its licence in the exhibit and in the site footer. That attribution is not decorative: it stays with the work.
Sources
Labour productivity, hourly compensation and unit labour cost, second quarter 2026
Published 3 September 2026. Read the source. Source of the quarterly business-sector labour productivity figure discussed in this issue.
Canadian ICT Sector Profile 2024
Data year 2024. Read the source. Source of the sector size, growth, employment, salary and research spending figures cited here.
Both sources are official Government of Canada publications. They are cited for their statistics only; neither organisation has reviewed, endorsed or sponsored this project.